Inflation in India: Types, Causes & UPSC Notes
Inflation is the sustained rise in the general price level of goods and services in an economy over time. It erodes purchasing power — the same amount of money buys less. For UPSC, inflation is not just a definition question. The exam tests your understanding of measurement indices, causes, the central bank’s response, the trade-offs involved, and real-world Indian data. This is one of the most high-yield topics in GS-III economics.
Measuring Inflation: CPI and WPI
India uses two main price indices to measure inflation. Understanding the difference is essential.
CPI — Consumer Price Index
The Consumer Price Index measures the change in prices of a basket of goods and services that a typical household consumes. It reflects the cost of living from the consumer’s perspective.
Base year: 2012 (revised from 2010 in 2015) Released by: Ministry of Statistics and Programme Implementation (MoSPI), in collaboration with the Labour Bureau
CPI basket composition (approximate):
| Category | Weight in CPI |
|---|---|
| Food and Beverages | 45.86% |
| Housing | 10.07% |
| Fuel and Light | 6.84% |
| Clothing and Footwear | 6.53% |
| Miscellaneous (education, health, transport) | 28.32% |
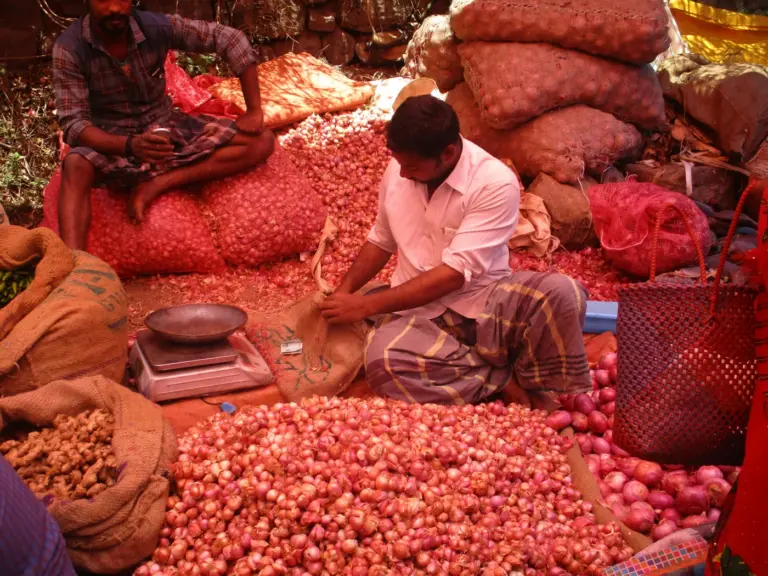
Food dominates the CPI basket — this makes India’s CPI highly sensitive to food price shocks (vegetable prices, monsoon failures, supply chain disruptions). The CPI for Rural and Urban areas are computed separately and combined into a combined CPI.
CPI is the RBI’s headline inflation measure for monetary policy purposes. This is critical for UPSC.
WPI — Wholesale Price Index
The Wholesale Price Index measures price changes at the producer/wholesale level — before goods reach consumers.
Base year: 2011-12 Released by: Office of the Economic Adviser, Ministry of Commerce and Industry Frequency: Monthly
WPI basket composition:
| Category | Weight in WPI |
|---|---|
| Primary Articles (food, minerals) | 22.62% |
| Fuel and Power | 13.15% |
| Manufactured Products | 64.23% |
WPI has a higher weight for manufactured products and captures upstream price pressures. It’s an indicator for industry and used in price escalation clauses in contracts.
CPI vs WPI: Key Differences
| Parameter | CPI | WPI |
|---|---|---|
| Perspective | Consumer | Producer/Wholesale |
| Covers services | Yes | No |
| Food weight | ~46% | ~22% |
| Base year | 2012 | 2011-12 |
| Released by | MoSPI | Ministry of Commerce |
| Used for monetary policy | Yes (RBI target) | No |
| Captures retail prices | Yes | No (wholesale only) |
WPI-CPI divergence is a frequently asked UPSC topic. WPI can be low (or even negative) while CPI remains high — this happens when wholesale manufactured prices fall due to global commodity deflation but food prices (dominant in CPI) stay elevated due to domestic supply factors.
Core vs Headline Inflation
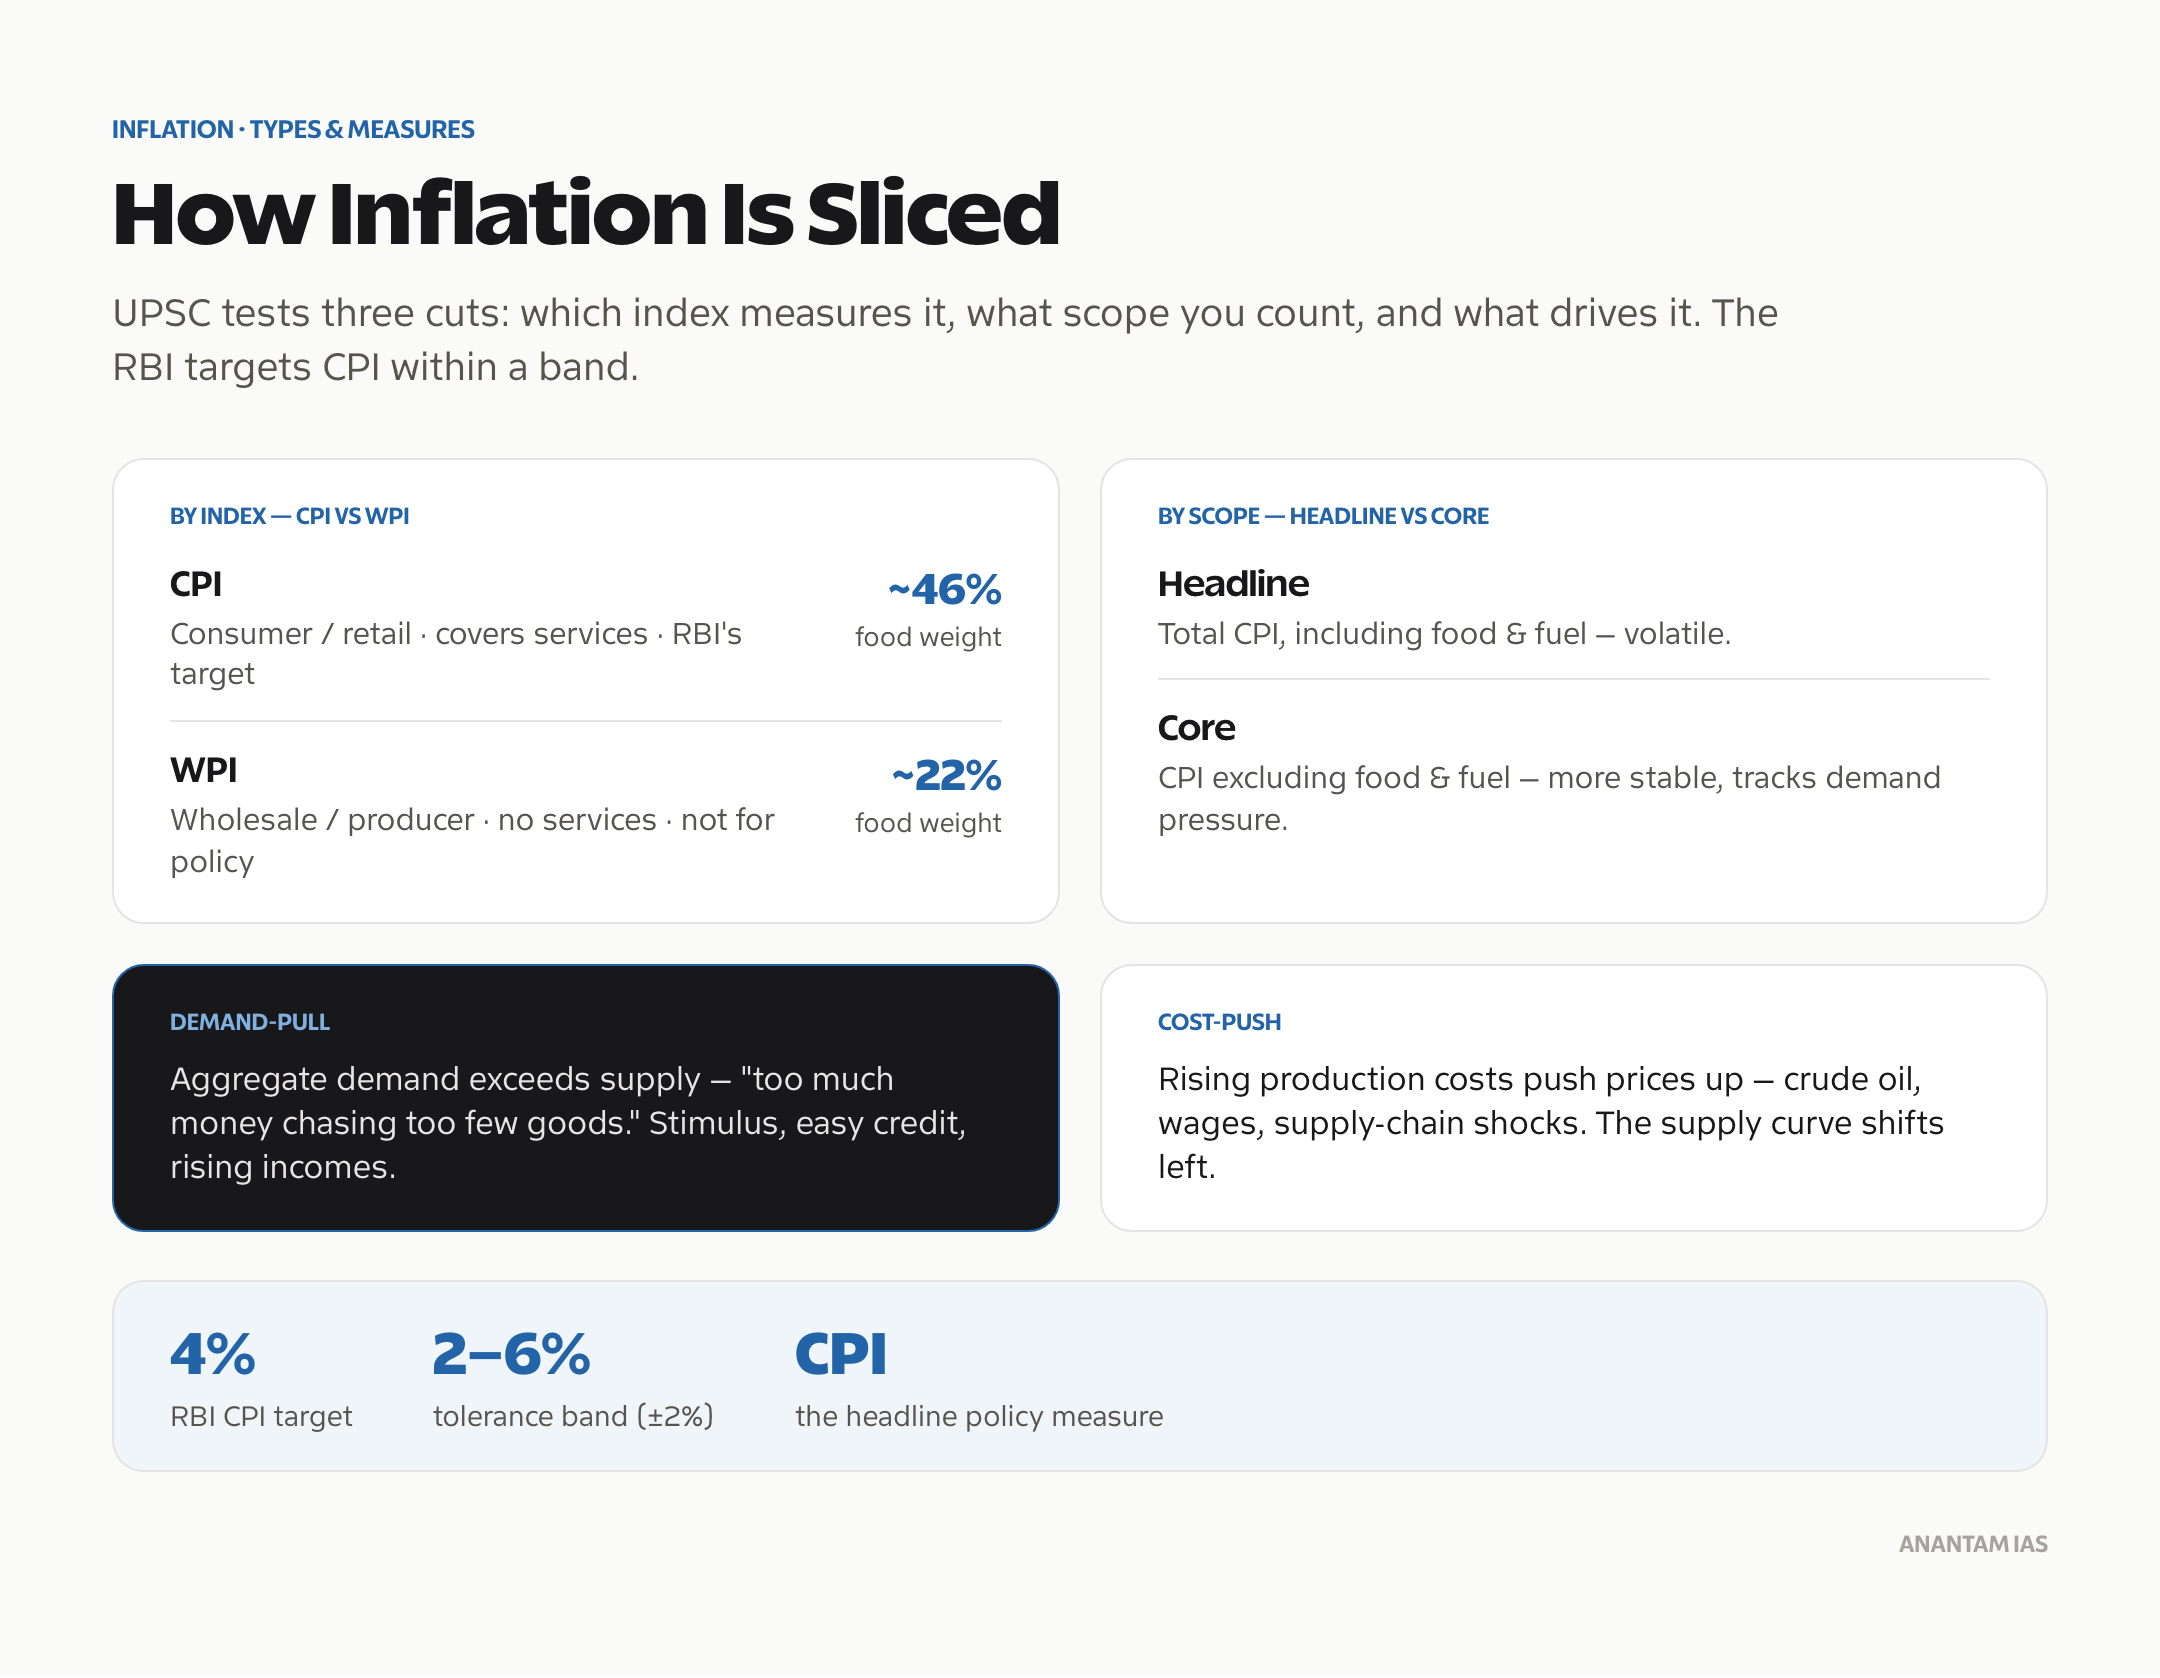
Headline inflation: Total CPI including food and fuel Core inflation: CPI excluding food and fuel (also called “underlying” or “non-food non-fuel”)
Core inflation is considered more stable and a better indicator of demand-driven price pressures. The RBI watches core inflation closely because it’s less influenced by supply-side shocks.
Types of Inflation
Demand-Pull Inflation
Occurs when aggregate demand in the economy exceeds aggregate supply. “Too much money chasing too few goods.” Typical causes: government stimulus spending, easy credit, rising incomes, export booms.
In India, post-COVID fiscal stimulus and pent-up demand contributed to demand-pull pressures in 2021-22.
Cost-Push Inflation
Occurs when production costs rise, forcing producers to raise prices. The supply curve shifts left — the same demand now faces higher prices. Causes: rising crude oil prices, wage increases, supply chain disruptions, input cost inflation.
The global surge in inflation in 2021-22 was largely cost-push — driven by the Ukraine war raising energy and food commodity prices, and supply chain disruptions from COVID.
Structural Inflation
Rooted in structural rigidities in the economy — poor infrastructure, agricultural inefficiencies, supply bottlenecks, monopolistic pricing. India’s persistent food inflation has structural causes: fragmented supply chains, poor cold storage infrastructure, APMC market inefficiencies, and high intermediary margins.
Built-In (Wage-Price) Inflation
Also called “wage-price spiral.” Workers demand higher wages to compensate for rising prices. Higher wages raise production costs. Producers raise prices. Workers demand higher wages again. This self-reinforcing loop is rare in India given the large informal labour market.
Stagflation
A toxic combination of high inflation + economic stagnation (low growth or recession) + high unemployment. The 1970s global oil shocks caused stagflation in many countries. India’s 2019-20 period — where growth slowed significantly but food inflation remained high — had mild stagflationary characteristics.
Deflation and Disinflation
Deflation: Sustained fall in the general price level. Dangerous because it discourages spending (consumers wait for further price falls), increases the real burden of debt, and can trigger recession.
Disinflation: The rate of inflation is falling but prices are still rising. For example, if CPI falls from 8% to 5%, that’s disinflation, not deflation. The RBI aims for disinflation — bringing inflation back to the 4% target.
The Phillips Curve: Inflation-Unemployment Trade-off
The Phillips Curve (named after economist A.W. Phillips, 1958) shows an inverse relationship between inflation and unemployment. When unemployment is low, inflation tends to be higher (strong labour demand → wage pressure → price rises). When unemployment is high, inflation tends to be lower.
This trade-off gave policymakers a menu: accept slightly higher inflation to get lower unemployment, or tolerate more unemployment to control inflation.
Breakdown of the Original Phillips Curve
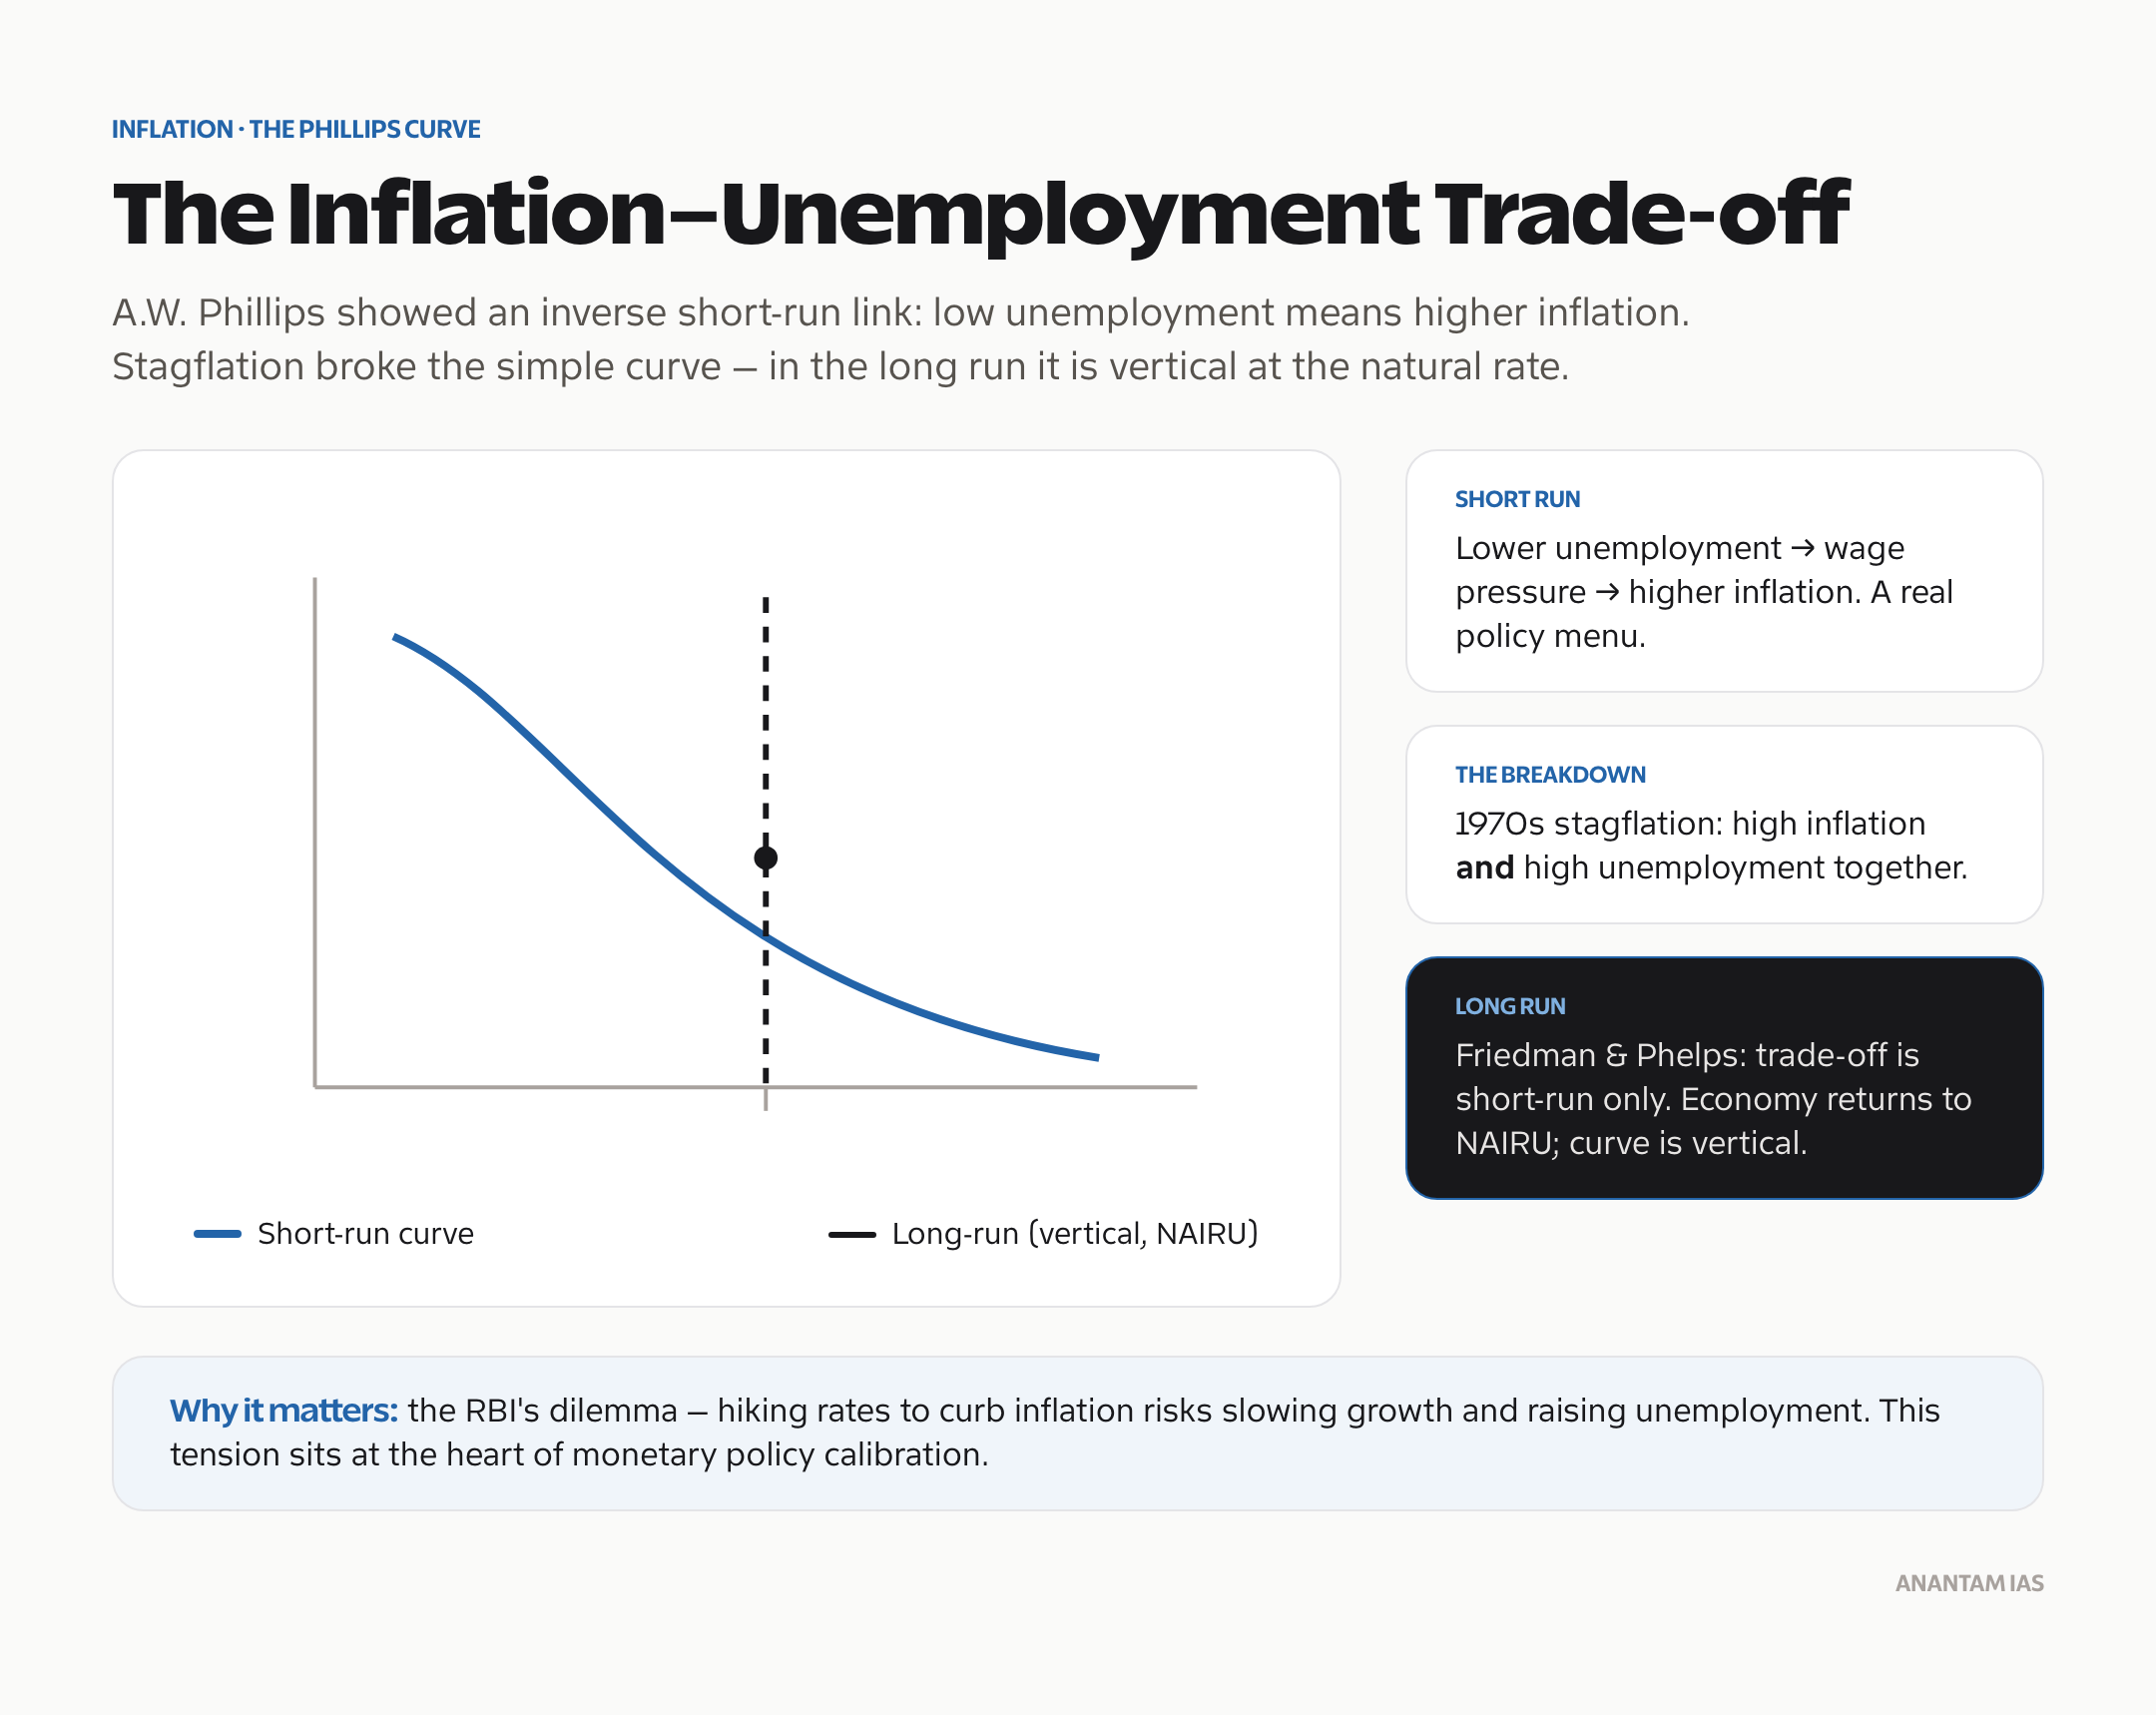
The stagflation of the 1970s broke the simple Phillips Curve — high inflation and high unemployment coexisted. Milton Friedman and Edmund Phelps argued the trade-off only holds in the short run. In the long run, the economy converges to the natural rate of unemployment (NAIRU — Non-Accelerating Inflation Rate of Unemployment), and the long-run Phillips Curve is vertical.
For UPSC: The Phillips Curve is relevant when discussing the RBI’s monetary policy dilemma — raising interest rates to fight inflation risks slowing growth and raising unemployment. This tension is at the heart of monetary policy calibration.
RBI’s Inflation Targeting Framework
India adopted Flexible Inflation Targeting (FIT) as the monetary policy framework in 2016, through amendments to the RBI Act.
The Target
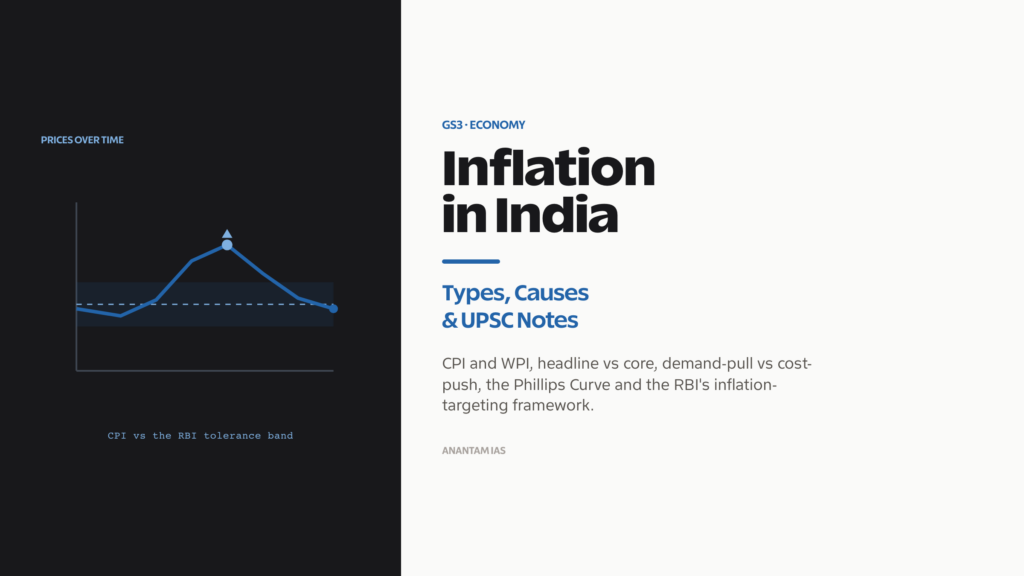
The Monetary Policy Committee (MPC) is mandated to maintain retail inflation (CPI) at 4%, with a tolerance band of ±2% — so the acceptable range is 2% to 6%.
If inflation breaches the upper tolerance limit (6%) for three consecutive quarters, the RBI must report to the government explaining the reasons for failure and the corrective steps. This accountability mechanism is called the “failure clause.”
Monetary Policy Committee (MPC)
Established in 2016 under the RBI Act:
- 6 members: RBI Governor (Chair), RBI Deputy Governor (in charge of monetary policy), one RBI officer nominated by the RBI Board, + 3 external members nominated by the Central Government
- Decisions by majority vote; Governor has casting vote in case of tie
- Meets at least 4 times a year (in practice, every 2 months)
The MPC uses the repo rate (the rate at which RBI lends to banks) as its primary policy instrument. Raising repo rate increases borrowing costs, reduces demand, and brings down inflation. Lowering it stimulates demand.
Policy Rate Instruments
| Instrument | What It Is | Current (approx.) |
|---|---|---|
| Repo Rate | Rate at which RBI lends to banks overnight | ~6.5% (varies) |
| Reverse Repo Rate | Rate at which RBI borrows from banks overnight | ~3.35% |
| Cash Reserve Ratio (CRR) | Fraction of deposits banks must keep with RBI (earns no interest) | ~4% |
| Statutory Liquidity Ratio (SLR) | Fraction of deposits banks must keep in approved securities | ~18% |
| Marginal Standing Facility (MSF) | Emergency borrowing from RBI at higher rate | Repo + 0.25% |
Recent Inflation Trends in India
| Year | Average CPI Inflation | Key Driver |
|---|---|---|
| 2019-20 | 4.8% | Food price spike (onion, pulses) |
| 2020-21 | 6.2% | Supply chain disruption, food inflation |
| 2021-22 | 5.5% | Recovery demand, commodity prices |
| 2022-23 | 6.7% | Ukraine war → energy + food commodities |
| 2023-24 | 5.4% | Easing commodity prices, tight monetary policy |
| 2024-25 | ~4.8% (est.) | Gradual convergence toward target |
India’s inflation breached the 6% upper tolerance in 2022-23, largely due to the Russia-Ukraine war’s impact on global food and energy prices. The RBI responded with aggressive rate hikes — raising repo rate from 4% to 6.5% between May 2022 and February 2023. Inflation has since moderated but food price volatility (especially vegetables, pulses, edible oils) remains a recurring challenge.
Inflation and Its Effects
On Borrowers and Lenders: Inflation benefits borrowers (real value of debt falls) and hurts lenders (real value of repayment falls). This is why debtors prefer inflation and creditors oppose it.
On Savings: High inflation discourages financial savings (deposits, bonds) and encourages investment in real assets (gold, real estate) as inflation hedges. This is a structural challenge in India — household savings in physical assets vs financial assets.
On Fixed Income Earners: Pensioners, government employees (before DA revision), and informal workers on fixed wages lose purchasing power.
On External Sector: High domestic inflation makes exports more expensive and imports cheaper, worsening the trade balance. It also pressures the exchange rate.
On Growth: Moderate inflation (2-4%) can be growth-supportive. Very high inflation creates uncertainty, disrupts investment planning, and acts as a tax on the poor.
Frequently Asked Questions
1. What is India’s official inflation target?
The RBI’s Monetary Policy Committee targets
4% CPI inflation with a tolerance band of ±2% (range: 2% to 6%). If CPI stays above 6% for three consecutive quarters, the RBI must explain the failure to the government. This flexible inflation targeting framework was adopted in 2016.nn2. What is the difference between CPI and WPI?
CPI measures consumer-level retail price changes; WPI measures wholesale-level price changes. CPI includes services; WPI doesn’t. CPI gives ~46% weight to food; WPI gives ~64% weight to manufactured goods. Only CPI is used for RBI’s monetary policy target.
3. What causes food inflation in India?
Food inflation in India is driven by structural factors: fragmented supply chains, inadequate cold storage, APMC market inefficiencies, high intermediary margins, weather shocks (monsoon failure, floods), and export policies on key commodities. Vegetables and pulses are the most volatile components.
4. What is stagflation? Has India experienced it?
Stagflation is high inflation combined with economic stagnation. India’s 2019-20 period (GDP growth ~4%, food inflation high) had mild stagflationary characteristics. True stagflation — as seen in the 1970s globally — has not been severe in India’s post-liberalisation history.
5. What is the Phillips Curve and why does it matter for UPSC?
The Phillips Curve shows the short-run trade-off between inflation and unemployment. When the RBI raises rates to fight inflation, it risks slowing growth and raising unemployment — this is the Phillips Curve dilemma. The long-run Phillips Curve is vertical, meaning there’s no permanent trade-off.
Tell Google you want more of this.
Add Anantam IAS as a preferred sourceOne tap, and this site shows up more often in your own Top Stories, AI Overviews and AI Mode. Remove it any time.