El Niño is the warm phase of the El Niño-Southern Oscillation, the most consequential mode of interannual climate variability on the planet, and the single ocean-atmosphere phenomenon that UPSC geography expects an aspirant to handle without hesitation. The name comes from Peruvian fishermen who noticed unusually warm coastal waters arriving around Christmas, and it refers to the periodic warming of sea surface temperatures across the central and eastern equatorial Pacific Ocean. When that warming crosses a defined threshold and persists, the entire tropical atmosphere reorganises, and the consequences reach from drought in Australia and the Indian subcontinent to flooding on the western coast of South America.
El Niño does not operate in isolation. It is one half of a coupled ocean-atmosphere oscillation, with La Niña, the cool phase, sitting on the other side, and ENSO-neutral conditions in between. The Southern Oscillation, identified by Sir Gilbert Walker in the 1920s while he was Director General of Observatories in colonial India, refers to the seesaw of atmospheric pressure between Tahiti and Darwin. The ocean side, the El Niño warming, and the atmospheric side, the Southern Oscillation, were stitched together by Jacob Bjerknes in the 1960s into what we now call ENSO. For UPSC, El Niño is tested in GS Paper 1 physical geography, GS Paper 3 environment and disaster management, and frequently appears in prelims as a direct factual question on monsoon impact.
Quick Facts at a Glance
| Parameter | Value |
|---|---|
| Phenomenon | Warm phase of ENSO |
| Ocean basin | Central and eastern equatorial Pacific |
| Definition threshold | Niño 3.4 SST anomaly above 0.5°C for 5 consecutive overlapping 3-month periods |
| Typical duration | 9-12 months, occasionally up to 2 years |
| Recurrence | Every 2-7 years (irregular) |
| Discovery of Southern Oscillation | Gilbert Walker, 1920s |
| Coupled ENSO framework | Jacob Bjerknes, 1969 |
| Recent strong events | 1997-98, 2015-16, 2023-24 |
| Indian monsoon impact | Below-normal rainfall in 60% of El Niño years |
What El Niño Actually Is
Under normal Pacific conditions, easterly trade winds push warm surface water westward across the equatorial Pacific. The warm pool piles up around Indonesia and the western Pacific, while cold, nutrient-rich water upwells along the coast of Peru and Ecuador. Sea surface temperatures in the western Pacific routinely exceed 29°C, while the eastern Pacific stays in the low 20s. This temperature gradient drives the Walker circulation, a vast east-west atmospheric loop with rising air and heavy convection over Indonesia and sinking, dry air over the eastern Pacific.
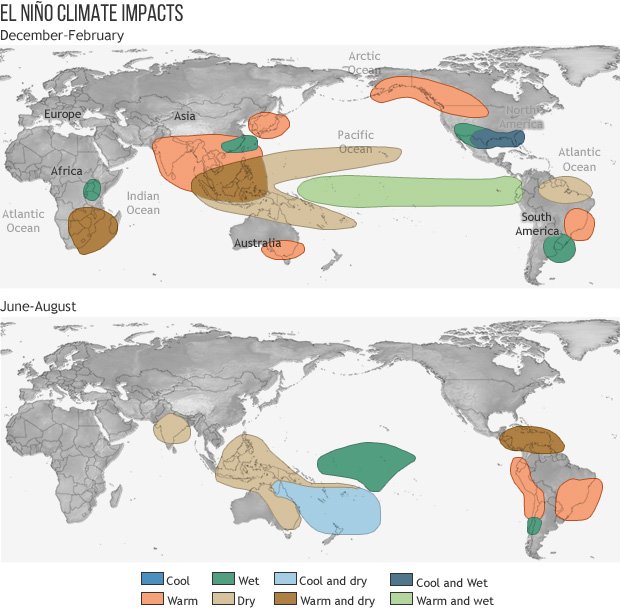
During El Niño, the trade winds weaken or even reverse. Without the easterly push, the warm pool sloshes back eastward across the Pacific. Sea surface temperatures in the central and eastern Pacific climb 1-3°C above normal, sometimes more. The Walker circulation flattens out or reverses, shifting the centre of deep atmospheric convection from Indonesia to the central Pacific. Indonesia and Australia, which depend on that convection for rain, dry out. South America, which normally sits under sinking dry air, gets storms and flooding.
The reorganisation is not subtle. The thermocline, the boundary between warm surface water and cold deep water, deepens in the east and shallows in the west. Coastal upwelling off Peru collapses, devastating anchovy fisheries that depend on cold, nutrient-rich water. Atmospheric Kelvin waves and oceanic Rossby waves propagate the signal across the basin. Within months, the entire tropical Pacific is in a different climate state.
Walker Circulation Reversal
The Walker circulation is the engine that translates a Pacific Ocean anomaly into a global weather signal. In normal years, the loop has rising motion over the maritime continent of Indonesia and sinking motion over the cold tongue of the eastern Pacific. The rising branch pumps moisture into the atmosphere and feeds the heavy monsoonal rains of the western Pacific. The sinking branch suppresses cloud formation off Peru.
During El Niño, that loop weakens, splits, or reverses. The rising motion migrates eastward to the central Pacific, sometimes as far as the date line. The sinking branch shifts west, parking dry, descending air over Indonesia, northern Australia, and, critically for India, over the maritime continent that normally seeds the monsoon trough. This is the mechanism by which a Pacific warming reaches into the Indian Ocean and disrupts the southwest monsoon.
The Hadley circulation, the meridional north-south overturning, also responds. The subtropical jet strengthens, the polar jet shifts, and mid-latitude storm tracks reorganise. These changes are the teleconnections, the long-distance atmospheric pathways through which an equatorial Pacific event reaches California, southern Africa, and the Indian subcontinent.
El Niño and the Indian Monsoon
The Indian southwest monsoon is the most important weather system in South Asia, delivering roughly 75% of the country’s annual rainfall between June and September. The relationship between El Niño and the monsoon is one of the most studied teleconnections in climate science, and it is overwhelmingly negative. Of the major historical El Niño years, around 60% have produced below-normal monsoon rainfall in India, with the strong events frequently triggering outright drought.
The mechanism works through several pathways. First, the eastward shift of convection drains atmospheric moisture from the maritime continent, weakening the cross-equatorial flow that feeds the monsoon trough. Second, the altered Walker circulation produces anomalous subsidence over the Indian Ocean and the Indian subcontinent, suppressing the deep convection that fuels monsoon rainfall. Third, El Niño often shifts the location of the monsoon trough northward and weakens the low-pressure systems that travel along it.
Historical El Niño droughts in India have been catastrophic. The 1877 event triggered the Great Famine, killing an estimated 5 million people. The 1899 event produced another devastating famine. More recently, the 2002, 2009, 2014, and 2015 monsoons all underperformed during El Niño conditions. The 2023 monsoon, coinciding with the developing 2023-24 El Niño, ended at 94% of the Long Period Average, the lowest since 2018.
The relationship is not deterministic, however. The 1997-98 El Niño, one of the strongest on record, produced a normal Indian monsoon. The Indian Ocean Dipole, the Madden-Julian Oscillation, and Atlantic SSTs can all modulate the El Niño signal. A positive Indian Ocean Dipole, in particular, can counteract the El Niño drying effect, which is why monsoon forecasting requires watching the entire ocean-atmosphere system, not just the Pacific.
How El Niño Is Measured
The standard index is the Oceanic Niño Index, calculated from sea surface temperature anomalies in the Niño 3.4 region, a box from 5°N to 5°S and 170°W to 120°W in the central equatorial Pacific. NOAA declares an El Niño when the three-month running mean of the Niño 3.4 SST anomaly exceeds +0.5°C for five consecutive overlapping seasons. Australia’s Bureau of Meteorology uses a similar but slightly different threshold based on the Southern Oscillation Index.
Strength categories follow the peak Niño 3.4 anomaly. A weak El Niño peaks between +0.5°C and +0.9°C. Moderate events fall between +1.0°C and +1.4°C. Strong events reach +1.5°C to +1.9°C. Very strong events exceed +2.0°C, a threshold crossed only in 1982-83, 1997-98, and 2015-16. The 2023-24 event peaked around +2.0°C, placing it in the very strong category.
Recent El Niño Events
The 1997-98 El Niño was the strongest of the 20th century, with Niño 3.4 anomalies peaking above +2.3°C. It caused massive flooding in Peru and Ecuador, devastating wildfires in Indonesia, and severe drought in Papua New Guinea, but India’s monsoon that year escaped largely unscathed.
The 2015-16 event matched or exceeded 1997-98 in intensity. It triggered consecutive deficient monsoons in India in 2014 and 2015, contributed to a record global temperature in 2016, and caused widespread coral bleaching, including the worst event ever recorded on the Great Barrier Reef.
The 2023-24 El Niño developed in the second half of 2023 and peaked in December 2023 with Niño 3.4 anomalies near +2.0°C. It contributed to 2023 becoming the warmest year on record globally, a record promptly broken by 2024. India’s 2023 monsoon ended deficient at 94% of LPA. The event dissipated by mid-2024, transitioning into ENSO-neutral conditions and then a developing La Niña.
ENSO Neutral and the Wider System
ENSO-neutral, sometimes called La Nada, describes conditions when Niño 3.4 anomalies stay between -0.5°C and +0.5°C. In neutral years, the trade winds, Walker circulation, and Pacific SST gradient all sit close to their long-term averages. Neutral conditions are not always quiet, however; other modes like the Indian Ocean Dipole or the Madden-Julian Oscillation can still drive significant weather anomalies.
ENSO sits within a broader hierarchy of climate modes. The Pacific Decadal Oscillation operates on a 20-30 year cycle and modulates how strongly ENSO events translate into North American weather. The Atlantic Multidecadal Oscillation influences Atlantic hurricane activity. The Indian Ocean Dipole, identified by Saji and colleagues in 1999, is the Indian Ocean’s own coupled mode and frequently interacts with ENSO to shape the Indian monsoon. For a deeper look at how these atmospheric phenomena fit into the larger climate-versus-weather picture, the foundational climate vs weather distinction sets the time-scale framework. The opposite phase of El Niño is covered in detail in the La Niña explainer.
Climate Change and El Niño
Whether anthropogenic warming is changing El Niño behaviour is one of the more contested questions in climate science. The current evidence suggests that strong El Niño events are becoming more frequent, that El Niño-driven extreme weather is intensifying because the background climate is warmer, and that the spatial pattern of ENSO may be shifting. The IPCC Sixth Assessment Report concluded with high confidence that ENSO rainfall variability will increase under continued warming, even if the temperature variability of ENSO itself remains uncertain.
For India, the policy implications are direct. The monsoon’s interannual variability is already a stress on agriculture, water resources, and the rural economy. If El Niño droughts intensify under climate change, the buffers built into food security, groundwater management, and crop insurance need to scale accordingly.
Frequently Asked Questions
What is El Niño in simple terms?
El Niño is the warm phase of the El Niño-Southern Oscillation, characterised by warmer-than-average sea surface temperatures in the central and eastern equatorial Pacific Ocean. It disrupts the normal Walker circulation and reshuffles global weather patterns, typically causing drought in Australia and India and flooding in coastal Peru and Ecuador.
How often does El Niño occur?
El Niño occurs irregularly every 2-7 years, with each event typically lasting 9-12 months. Some events are weak and short-lived, while others, like 1997-98, 2015-16, and 2023-24, are strong and globally consequential. The recurrence is not periodic, which is why ENSO forecasting is probabilistic rather than deterministic.
Why does El Niño weaken the Indian monsoon?
El Niño shifts the centre of tropical Pacific convection eastward, draining atmospheric moisture from the maritime continent and parking anomalous sinking air over the Indian Ocean and subcontinent. This suppresses the deep convection that fuels monsoon rainfall, leading to below-normal monsoons in roughly 60% of El Niño years.
What is the difference between El Niño and the Southern Oscillation?
El Niño refers to the oceanic warming in the equatorial Pacific. The Southern Oscillation is the atmospheric seesaw of pressure between Tahiti and Darwin. Together they form ENSO, a single coupled ocean-atmosphere phenomenon. The two were unified into one framework by Jacob Bjerknes in 1969.
How is El Niño measured?
The standard measure is the Oceanic Niño Index, which tracks the three-month running mean sea surface temperature anomaly in the Niño 3.4 region (5°N-5°S, 170°W-120°W). An El Niño is declared when this anomaly exceeds +0.5°C for five consecutive overlapping seasons.
Did the 2023-24 El Niño affect India?
Yes. The 2023 southwest monsoon ended at 94% of the Long Period Average, classified as below normal and the lowest since 2018. The El Niño peaked in December 2023 with Niño 3.4 anomalies near +2.0°C, contributing to record global heat and below-normal monsoon rainfall across much of India.
Is El Niño getting worse with climate change?
The IPCC Sixth Assessment Report concludes with high confidence that ENSO-related rainfall variability will increase under continued warming. Strong El Niño events appear to be becoming more frequent, and El Niño-driven extreme weather is intensifying because the background climate is warmer.
What is the opposite of El Niño?
La Niña is the opposite phase, characterised by cooler-than-average sea surface temperatures in the central and eastern equatorial Pacific. La Niña typically strengthens the Indian monsoon, intensifies Atlantic hurricane activity, and brings wetter conditions to Australia and Southeast Asia.
Tell Google you want more of this.
Add Anantam IAS as a preferred sourceOne tap, and this site shows up more often in your own Top Stories, AI Overviews and AI Mode. Remove it any time.